Stop guessing what works. Every week, Claude finds the posts that beat your competitors’ own averages and breaks down exactly why.
Most competitor research is scrolling someone’s profile and copying whatever has the most views. That tells you who is big, not what worked. 100K views is a flop for an account with a million followers and a breakout for one with 20K.
This skill fixes that. It compares every post against that creator’s own normal, keeps the real outliers, and has Claude break each one down: the hook, the format, the structure, the CTA. Then it packages everything into one page you can read over coffee.
This guide walks you through building your own version with Claude Code. You won’t write the code yourself. Claude does that. Your job is to give it the right instructions, which are all below.
What you end up with
A weekly report of the Reels and carousels that outperformed across your whole competitor list, sorted by how far each one beat its creator’s average.
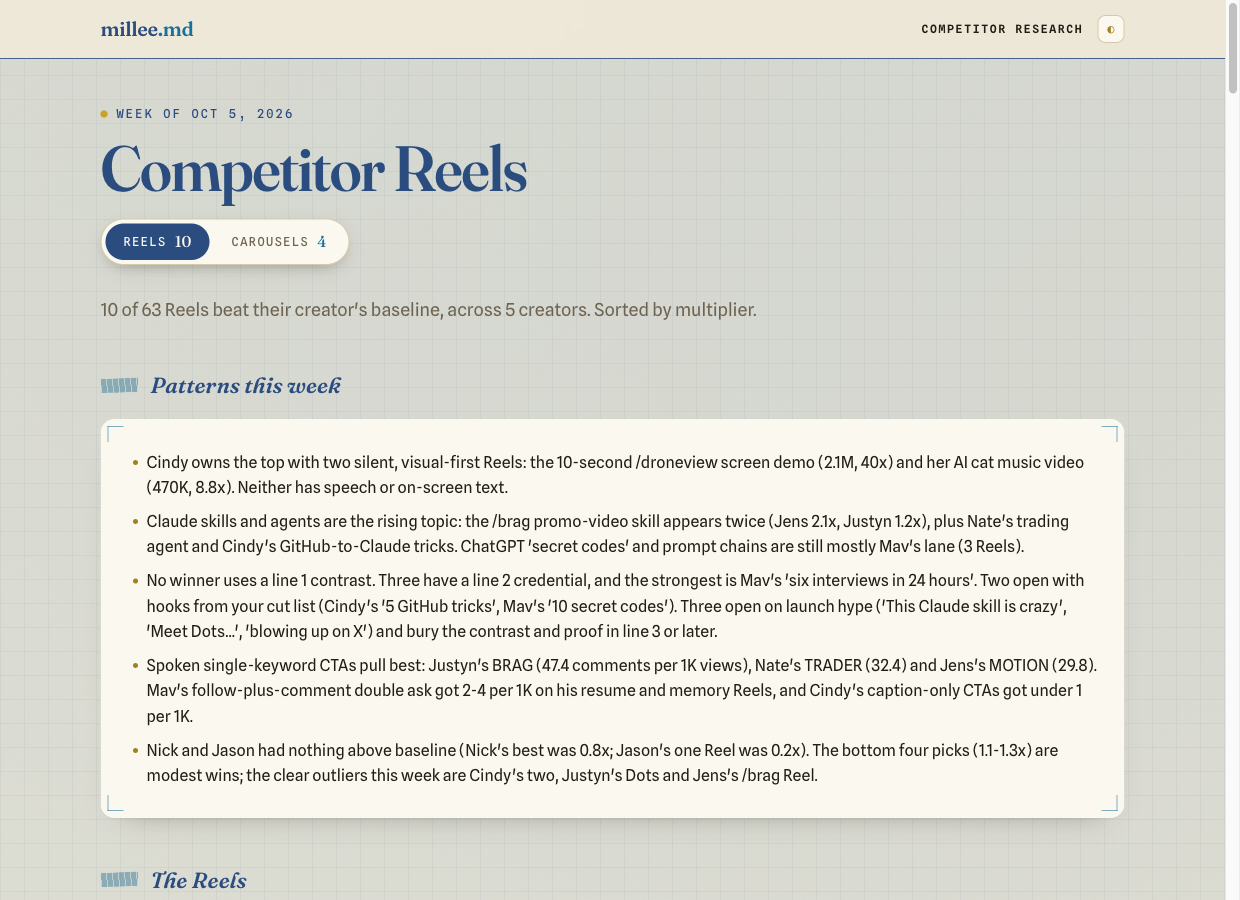
A breakdown of every winner: the hook (spoken and on-screen), the format, how many times it beat the creator’s normal, plays, likes, comments, and a slideshow of frames from the video so you can see the visual hook without opening Instagram.
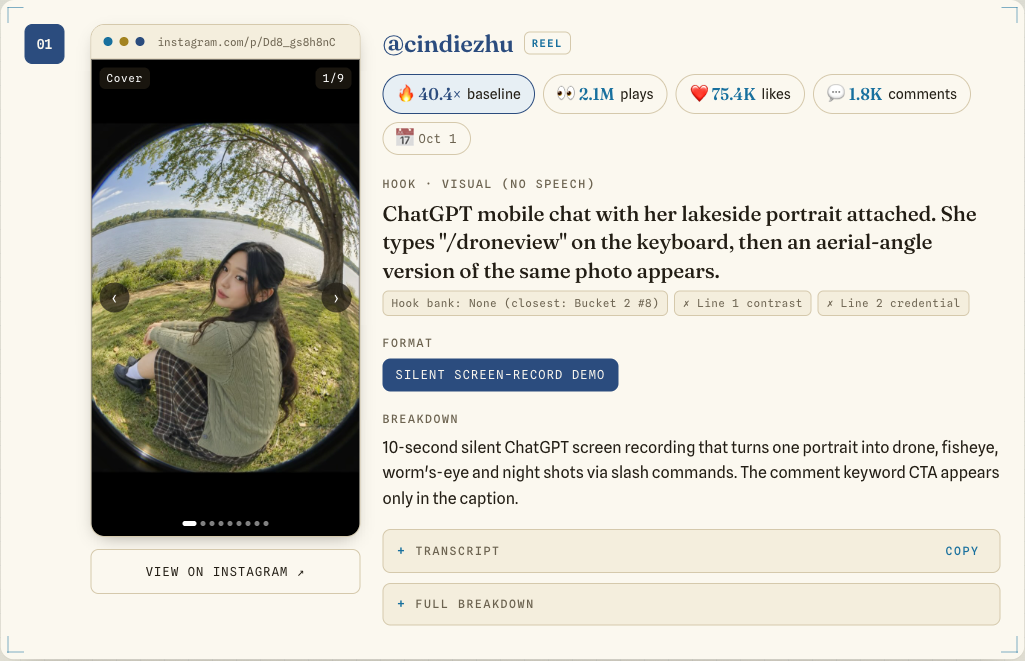
The full transcript, split into Hook, Setup, Payoff and CTA, with timestamps and a copy button. This is the part I use most when I’m writing my own version of an idea.
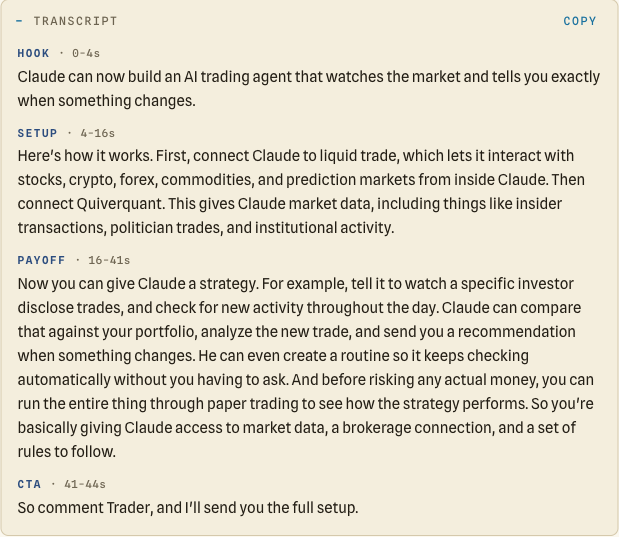
Carousels on their own tab, with every slide in a swipeable preview and the slide text transcribed.
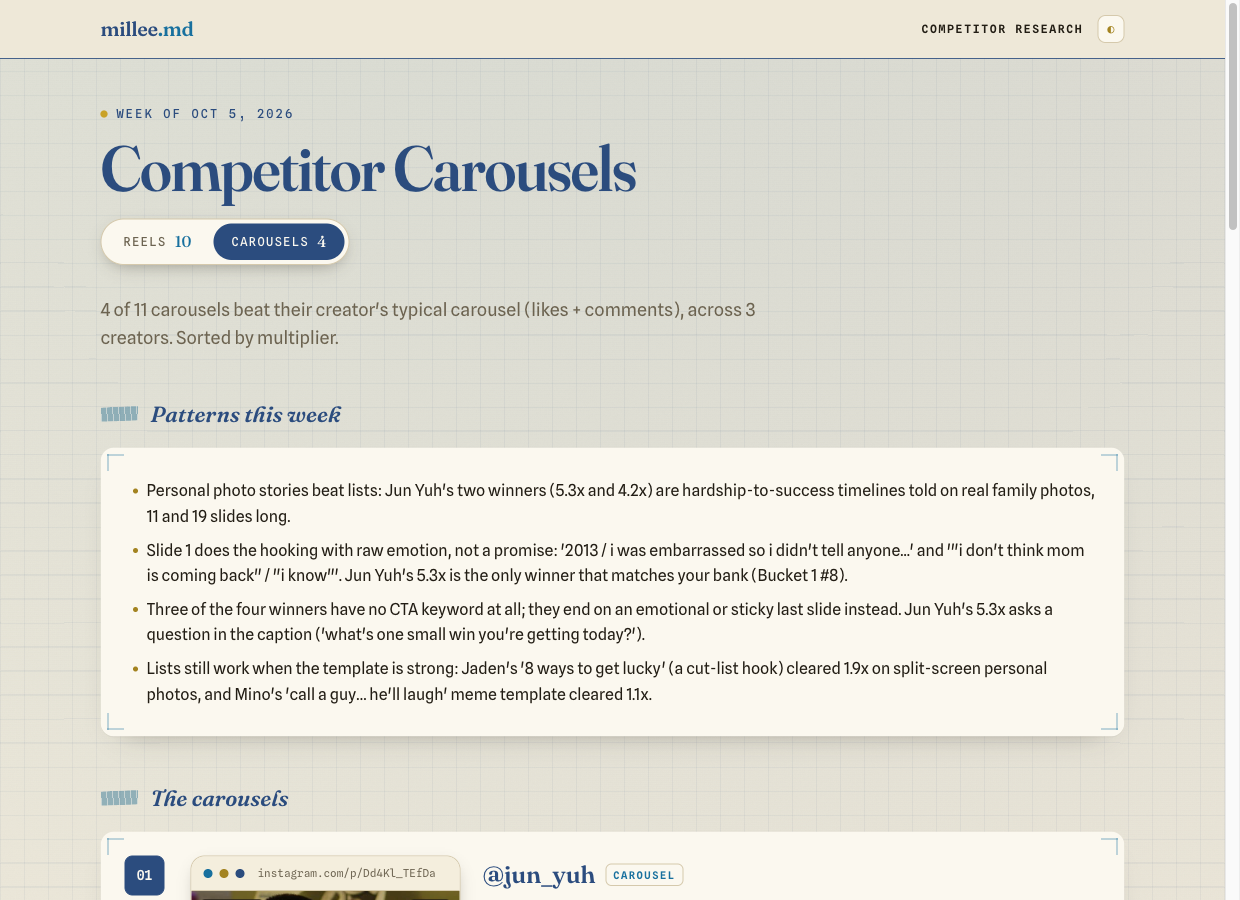
One sentence to run it. Once it’s set up, you open Claude Code and say “run competitor research”.
How it works
- Scrape. Claude reads your competitor list and uses Apify to pull every Reel and carousel those accounts posted in the last 7 days.
- Rank. A Python script scores each post against that creator’s own average, then keeps the top performers, with a cap per creator so one account can’t take over the list.
- Analyze. Claude spawns one sub-agent per winner, all running at the same time. Each one watches frames from the video, reads the transcript, and breaks down the hook, format, structure and CTA.
- Report. A second script turns everything into one HTML page and opens it in your browser.
Before you start
You need:
- Claude Code on a paid plan, in the desktop app or the terminal. The skill runs scripts and saves files on your computer, which is what Claude Code is for.
- An Apify account. The free plan gives you $5 of credit a month, which covers weekly runs. Grab your API token from Settings, then API & Integrations.
- ffmpeg and whisper.cpp for pulling video frames and transcribing audio on your own computer, for free. On a Mac,
brew install ffmpeg whisper-cpp. Claude can download a Whisper model for you. - 5 to 10 competitor handles. Pick accounts in your niche whose content you’d actually want to learn from, not just the biggest ones.
- About an hour for setup.
1. Make a folder and your competitor list
What it does: gives the skill one home, and one file that says who to track.
Create a folder called competitor-research on my Desktop. Inside it, create competitors.md with a YAML block listing these Instagram handles: [handle 1, handle 2, …]. Leave room for a baseline value per creator; we’ll fill those in later. Then create a Python virtual environment in the folder and install apify-client and pyyaml.
Add your Apify token as an environment variable called APIFY_TOKEN (Claude can add it to your shell profile for you). Don’t paste it into any file inside the folder.
2. Scrape the week’s posts
What it does: pulls every Reel and carousel your competitors posted in the last 7 days, plus their covers.
Write scripts/fetch-reels.py. It reads the handles from competitors.md and runs the Apify actor apify/instagram-reel-scraper with onlyPostsNewerThan “7 days”, skipPinnedPosts true, and up to 50 Reels per profile. Leave every paid add-on off (transcripts, shares, video download). Save the raw results to runs/YYYY-MM-DD/raw.json and download each Reel’s cover into runs/YYYY-MM-DD/thumbs/ straight away.
Before you write it, fetch the actor’s input schema and do a test run on one handle with 3 Reels, so you use the real output field names instead of guessing them.
For carousels, ask for a second script, fetch-carousels.py, that uses apify/instagram-post-scraper and keeps only posts of type “Sidecar”.
Three things I learned the hard way:
- Instagram has two view counts, and they don’t match. The Reel scraper gives you plays (
videoPlayCount). Other scrapers give you views, which run about 3.5x lower. Pick plays and use them everywhere. Mixing the two quietly made every score in my first report 3.5x too high. - Download covers and videos the moment you scrape. Instagram’s image and video links expire within days.
- Carousels have no view count at all. Use likes plus comments instead, and only ever compare a carousel with that creator’s other carousels. Reels get far fewer likes than carousels, so mixing them inflates everything.
3. Rank against each creator’s own normal
What it does: turns raw numbers into an outlier score, so you see who actually overperformed rather than who’s biggest.
Write scripts/rank-and-select.py. For each Reel, multiplier = plays ÷ that creator’s baseline. The baseline is the creator’s median plays across the weekly runs saved in runs/ over the last 4 weeks, this week included, counting each post once. If a creator has fewer than 6 Reels of history, fall back to the baseline in competitors.md. Keep Reels at 1.0x or higher, up to 10 in total and at most 3 per creator, sorted by multiplier. Do the same for carousels using likes + comments, an 8-week history, and up to 5 carousels with at most 2 per creator. Write the picks to selected.json and print every post with its score.
Why a rolling baseline: it costs nothing (it reuses scrapes you already paid for), it updates itself every week, and it compares posts of the same age. A Reel scraped at 3 days old shouldn’t be judged against one that’s had a month to collect plays.
Why the per-creator cap: some creators post 30 Reels a week. Without a cap, one prolific account fills your whole report.
4. Pull frames and transcripts on your computer
What it does: gives the sub-agents something to look at and something to read, without paying for video analysis APIs.
Write scripts/process-videos.py. For each Reel in selected.json, download the video, use ffmpeg to grab one frame at each of seconds 0, 1, 2 and 3 plus frames at 25, 50, 75 and 95 percent of the runtime, and tile all 8 into one contact sheet, sheet.jpg. Then transcribe the audio with whisper.cpp and save the transcript into selected.json. Delete the video afterwards. For carousels, download every slide and tile them into one sheet in order.
The contact sheet is the trick that makes the visual analysis work. The sub-agent reads one image and sees the on-screen hook, the format, the captions and the editing style. The cover alone often hides all of that.
One whisper.cpp tip: keep timestamps turned on. With them off, it silently drops words around the 30-second mark.
5. Spawn a sub-agent per winner
What it does: breaks down each post in parallel, against your own rules rather than generic advice.
This is the step that makes the report yours. Give the sub-agents the frameworks you actually use: your hook formulas, your script structure, your caption rules. Mine judge every hook against my own hook bank and check whether line 1 sets up a contrast and line 2 gives a reason to believe.
For each post in selected.json, spawn one sub-agent, all in a single message so they run in parallel. Each one reads my rule files ([your hook rules], [your structure rules]), the post’s caption, transcript and stats, and its contact sheet. It returns only a JSON object with: topic, the spoken hook, the on-screen hook text, which of my hook types it matches, the format as a 2 to 4 word label, a summary of 30 words or fewer, the visual devices used, the transcript split word for word into Hook / Setup / Payoff / CTA with timestamps, the CTA type and keyword, and a one-line verdict on the caption. Merge the results into breakdowns.json, then write 3 to 5 bullet points on the patterns across this week’s winners.
Set word limits. Without them, every field turns into a paragraph and the report becomes a wall of text. Mine took three rounds of cutting before it was scannable.
6. Build the report
What it does: turns the JSON into a page you’ll actually want to read.
Write scripts/build-report.py. It merges selected.json and breakdowns.json into one HTML page at runs/YYYY-MM-DD/report.html and opens it. Reels and carousels each get their own tab with a toggle at the top. Each card has: a slideshow of the cover and frames, the creator handle, pills for the multiplier, plays, likes, comments and date, the hook, the format, the summary, and collapsible sections for the transcript and the full breakdown. Match my brand: [your colours and fonts, or your website’s URL].
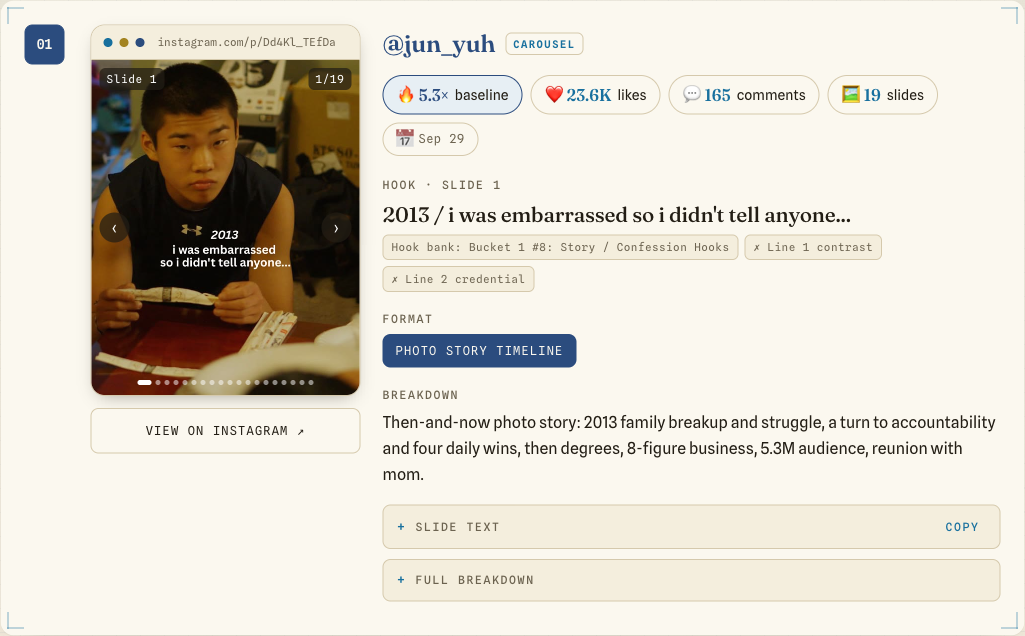
If your website has a CSS file with your colours, point Claude at it. Mine reads my site’s colour file on every build, so a palette change on the site shows up in the next report automatically.
7. Turn it into a skill
What it does: turns six scripts into one sentence.
Write a SKILL.md for this folder that walks through the whole weekly run in order: fetch, rank, process media, spawn the sub-agents, merge, build the report, and reply with a short summary of the top posts. Include the sub-agent prompt word for word. Then link the folder into ~/.claude/skills so I can run it from any Claude Code session by saying “run competitor research”.
Start a new Claude Code session and say it. A full run takes about 5 to 10 minutes.
What it costs
| Per weekly run | |
|---|---|
| Scraping Reels (my 7 competitors) | about $0.17 |
| Scraping carousels (my 11 creators) | about $0.20 |
| Frames, transcripts, analysis, report | $0 (your computer and your Claude plan) |
| Total | about $0.37, or roughly $1.60 a month |
That fits inside Apify’s free $5 a month. The one way to blow through it is testing: I used my whole month’s credit in a few days of building. Keep test runs to one handle and three posts.
Mistakes I made so you don’t have to
- Ranking by raw views. Big accounts win every week, and you learn nothing. Always score against the creator’s own average.
- Mixing views and plays. Pick one metric and use it for both the scores and the baselines.
- Paying for transcripts. The scraper’s transcript add-on charged for every Reel, including the ones I never looked at. Transcribing only the winners locally costs nothing and was 97 to 99 percent identical.
- Letting fields run long. A report you won’t read is worthless. Cap every field.
- A single week as the baseline. Fine for creators who post daily, useless for someone who posts once a week. Four weeks of history fixes it.
- Scraping too few posts. One creator on my list posts in bursts of five Reels in ten minutes. A 25-post cap cut off half his week. Set it to 50.